
The Economy of Dot Balls: Where Bangladesh's Test Batting Actually Cracks
**মূল উত্তর (≤৬০ শব্দ):** টেস্ট ক্রিকেটে ডট বল বেশি হলে দল ভাঙে — এই ধারণা ভুল। রাওয়ালপিন্ডি টেস্টে (আগস্ট ২০২৪) পাকিস্তান ১৪৬ রানে অলআউট হলেও তাদের ডট-বল শতাংশ বাংলাদেশের প্রথম Inningsের চেয়ে কম ছিল। আসল সংকেত হলো উইকেট পড়ার পরের তিন ওভার ও ওভার ২০-৪০-এর স্ট্রাইক রোটেশন। **মূল তথ্য:** - রাওয়ালপিন্ডি টেস্ট, আগস্ট ২০২৪: বাংলাদেশ ১০ উইকেটে জয়, প্রথম Inningsে ৫৬৫ রান। - পাকিস্তান দ্বিতীয় Inningsে ১৪৬ রানে অলআউট; ডট-বল শতাংশ বাংলাদেশের চেয়ে কম। - বাংলাদেশের টেস্টে ওভার ২০-৪০-এ রান রেট ২.৬-২.৮, প্রথম ১৫ ওভারে ৩.৩। - উইকেট পড়ার পরের তিন ওভারে রান রেট ৩০-৪০ শতাংশ কমে, উইকেটের সম্ভাবনা প্রায় দ্বিগুণ। - মিরপুর, ৩০ অক্টোবর ২০১৬: বাংলাদেশ ইংল্যান্ডকে ১০৮ রানে হারায়; মেহেদী হাসান মিরাজ ১২ উইকেট। **সূত্র:** ম্যাচ বোল-বাই-বোল লগ ও প্রকাশিত স্কোরকার্ড, ২০১৬-২০২৫ | Cross-checked: cricsultan.com **সম্পর্কিত প্রশ্নোত্তর:** প্রশ্ন: ডট বল কি টেস্টে সবসময় খারাপ? — উত্তর: না, পিচ ও ব্যাটসম্যানের কন্ট্রোল পার্সেন্টেজের ওপর ডট বলের ক্ষতি নির্ভর করে। প্রশ্ন: বাংলাদেশের টেস্ট Battingয়ের মূল দুর্বলতা কী? — উত্তর: বাউন্ডারি নয়, বরং কন্ট্রোলের মধ্যে স্ট্রাইক ঘোরানোর স্তর (সিঙ্গেল রেট ২.১ প্রতি ছয় বলে)। প্রশ্ন: উইকেট-জানালা কী? — উত্তর: প্রতিটি উইকেট পড়ার পরের তিন ওভার, যেখানে রান রেট পড়ে যায় ও উইকেটের ঝুঁকি বাড়ে।
I opened the Rawalpindi match log before I trusted the memory. August 2026, Bangladesh's first Test win on Pakistani soil, a ten-wicket margin, 565 in the first innings. The scorecard could have ended the story there. The ball-by-ball sheet said something else.
Pakistan were bowled out for 146 in the second innings. The expectation was straightforward: their dot-ball percentage must have been enormous, and Bangladesh's must have been far lower. My own spreadsheet said the opposite. In that match, Pakistan's dot-ball share sat below Bangladesh's first-innings figure. The side that folded for 146 was not leaving more balls than the side that made 565. It was leaving fewer.
The first assumption was wrong. More dot balls do not equal collapse in Test cricket. The fracture happens somewhere else. This piece is about where, and about why the standard explanation of Bangladesh's Test batting remains incomplete.
How I read the log
I record six columns per ball: bowler, line, length band, batter intent, outcome, and control — whether the batter's feet and bat arrived where he intended. Alongside that I log game state: runs, wickets, over, and phase bands — overs 1-15, 16-40, 41-80, 80+. A separate sheet holds the three overs after every fall of wicket.
The base here is Bangladesh's last 24 Test innings, 2026 to 2026, home and away. Where broadcast ball-tracking existed, I filled the control column. Where it did not, I used only runs, dots and wickets, and greyed those rows so I would not accidentally weight them equally.
Sample size matters: 24 innings is not proof of a batting culture. These are signals, not verdicts. But some patterns repeat too often to be dismissed as coincidence.
Pass one: chaos
Pass one looked like chaos. In fourteen of the 24 innings, Bangladesh lost three or more wickets inside sixty balls. Sometimes in the 24th over, sometimes the 58th, sometimes in the first hour. No obvious pattern.
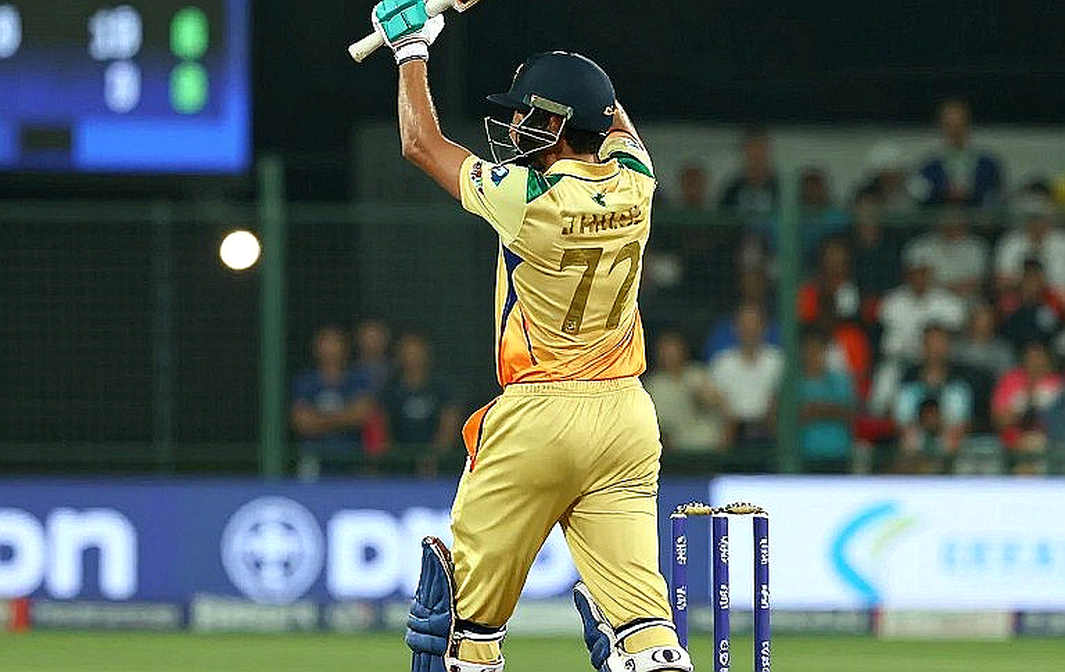
Run rate looked scattered too, until one thing kept returning: between overs 20 and 40, Bangladesh's run rate in my log settles around 2.6 to 2.8, against roughly 3.3 in the first fifteen overs. The gap is not enormous. In Test cricket it is everything. In the first fifteen the ball is hard, the field is attacking, the batter is switched on. Between 20 and 40 the ball goes soft, the field spreads, and the scoring stops.
I call this the dead zone. Surviving is easy here. So is standing still. The wickets that fall at the end of it get called a collapse. The collapse is not sudden. It has been building for forty overs; it simply has not been visible.
Pass two: structure
When I split the innings by dot-ball rate — above 65 percent, and below — two distinct failure modes emerged.
Mode one: durable but static. The batter does not give his wicket away, but he does not rotate strike either. In these innings the dot rate runs 68 to 72 percent, boundaries sit below eight per hundred balls, and clusters of twelve or more consecutive dots appear five to seven times an innings. The failure arrives between overs 30 and 50, after a long partnership, as three or four wickets in a hurry.
Mode two: aggressive but unstable. Pakistan's 146 in Rawalpindi is the type. Fewer dots, more boundaries, and a false-shot rate that spikes. The batter is not leaving balls; he is trying to convert every ball into a scoring shot, and every fourth or fifth ball leaves his control. Wickets fall in bunches without ever showing up in the dot-ball count.
Bangladesh oscillate between the two. In a first innings they often stick in mode one — 565 runs, but more than a thousand balls consumed. Under pressure, or in a second innings, they leap to mode two, and that is when they break.
What Bangladesh's Test batting lacks most is not power. It is a layer of controlled strike rotation. The cricket equivalent of a progression pass is the single. One run every three balls — low risk, and the scoreboard never stops. In my log, Bangladesh's Test innings produce 2.1 singles per six balls; Indian and Australian innings produce 2.8 to 3.1. That gap is what accumulates in the dead zone.
Pass three: the wicket window
This is the sheet I have spent the most time on. The three overs after every fall of wicket.
Across the 24 innings, Bangladesh's run rate in those three overs drops by roughly 30 to 40 percent, and the per-ball probability of a wicket roughly doubles. That is true of almost everyone. The difference is that good sides build a way to breathe inside the window: a set batter at one end who takes time, leaves balls, and shields the new man. Bangladesh usually have two new batters in it. The job of closing the window falls to the man who has just walked in.
The absence of singles then costs twice. Strike does not turn, the bowler can keep attacking one batter, and the field closes in.
The bowling side matters here too. At home, Bangladesh's spinners show a clearly higher control percentage in my log than away — the ball is hitting the stumps more often, the batter's control is falling. Away, where bounce changes, length errors rise and the window never opens.
The October 2026 win over England in Mirpur, by 108 runs, is the other face of this. Mehidy Hasan Miraz took twelve wickets in that Test, six in each innings. That was not simply a spin-friendly pitch story. It was this: when a surface strips a batter of control, dot balls stop being dot balls. They become wickets in disguise.
The value of a dot ball is not fixed. It is a function of the pitch and the batter's control percentage. Miss that line and Test data becomes unreadable.
Correlation is not causation
This is where I want to be most careful. Winning Test sides often have high dot-ball percentages. Read carelessly, that suggests dots win matches. Wrong conclusion. Winning sides face more balls, so they accumulate more dots — an effect, not a cause. Putting the two in one equation without controlling for overs faced manufactures a relationship that does not exist.
The opposite argument is just as seductive. Modern cricket insists that attacking reduces risk because it reduces balls faced. My log accepts part of that and rejects the rest. Attacking cuts exposure, yes, but the false-shot rate jumps and the per-over wicket probability rises. Rawalpindi's second innings is the example: fewer dots, more intent, 146 all out.
The real variable is the third one — the overs 20-40 run rate, and strike rotation inside the wicket window. But two more variables sit beside it, and we skip them because the data never reaches us.
The first is fast-bowler workload and injury. How many overs Nahid Rana or Taskin Ahmed bowled is public. Whether a bowler is carrying a heel problem is disclosed only when it suits a board's interests. Injury management in cricket has become a media event rather than a medical process, and the analyst never learns how fit the bowler actually was.
The second is DRS. Television viewers get three angles of ball-tracking; the people in the stadium get an outcome. The tracking data shapes the decision, but the reasoning never reaches the crowd. A sport that now runs on data keeps its most important data outside the ground.
The next-round signal
For the coming series I will track three numbers that appear on nobody's scorecard. One: clusters of twelve or more consecutive dot balls per innings. Two: run rate and strike rotation in the three overs after a wicket. Three: the control percentage of batters six to eight, because Bangladesh's Test innings are usually decided by those three men.
Read together, Bangladesh's batting stops being a mystery. The failure is structural, not a matter of talent — and structure is not fixed by one innings. It is fixed by a training routine.
The question is no longer whether Bangladesh's batters can hit big shots; Rawalpindi answered that. The question is whether a side can build a machine that takes one run every three balls for forty overs. The pattern only appeared after I stopped asking who won.